IN3038WP: Ethernet Debugger timing (draft)
Introduction
The Intona Ethernet Debugger can be used to intercept and capture traffic between two Ethernet devices. The device is normally not supposed to affect the Ethernet traffic itself. But for technical reasons, the device can affect the traffic by introducing additional latency and jitter compared to a simple Ethernet cable. This effect is minimal, but can matter for real time applications such as PTP. The goal of this document is to provide information about the introduced latency and jitter, as well as actual measurements.
Background
Intona Ethernet Debugger Internals
The device uses two standard PHYs to descramble, capture, and scramble Ethernet signals passing through the two ports. The data always directly passes trough the PHYs. The PHYs RGMII lines (including the clock) are directly connected with the counterparts. A consequence is that the expected latency is equal to the sum of both PHYs' latencies. In a way, the device acts as a switch with two ports. Unlike actual switches, there is no additional buffering or delay outside of the PHYs (other than the latency of normal signal propagation).
Capturing timestamps
If capturing is active, the device records a timestamp for each captured packet. These timestamps are displayed as "Arrival Time" in Wireshark. The timestamps are derived from an internal nanosecond counter. The counter runs at the FPGA's 100 MHz main clock, generated by the FPGA's PLL, clocked by the on-board 25 MHz oscillator (stability: 30ppm). The clock is always incremented by 10, which makes the resolution 10 ns, and the accuracy the same as the oscillator's.
A complication is that the timer needs to be made available to the RGMII logic, which requires clock domain crossing (CDC) to each of the RGMII clocks. This introduces significant jitter in firmware 1.00; in firmware 1.06 the jitter is much lower. For 10/100 MBit mode, the jitter might be higher than necessary, due to the used CDC method. It was optimized towards better behavior in 1000 MBit mode.
The timestamps are supposed to be useful for PTP, so the timestamp at time of SFD is captured, and not the start of the preamble.
The absolute timestamp values are fairly useless outside of the device, because it is strictly bound to the internal logic clock. It is not synchronized to an external reference. There is no PTP time synchronization, and PTP network packets do not affect the capture timestamping mechanism. However, it is useful for relative measurements within the device. The testing setup in this paper makes use of it by measuring packet arrival time differences.
Some further details are provided in the measurement section.
Other features
Some features of the device can be used to intentionally affect the Ethernet data stream. The host software provides commands to drop or corrupt packets, and it can insert new packets into the data stream (packet injector). These are implemented as combinatorial logic between the RGMII signals, and do not incur additional buffering on the data stream.
Packet injector
The packet injector feature can insert packets into the data stream. The device is not meant to be used as network card or as MAC, so special commands in the host software have to be used. The ability of the injector to send packets at the same time to both ports turns out to be useful to perform certain measurements.
For details see the measurement section.
PHY component details
The PHY component itself introduces latency and jitter, because it has to descramble and deserialize the Ethernet data (and the reverse in the transmit path). In addition, there is a synchronizing TX FIFO to compensate for clock jitter. This is mostly under exclusive control of the PHY vendor.
The PHY's datasheet provides the following numbers:
| Parameter | Min | Max |
|---|---|---|
| 1000BASE-T transmit latency (TX_CTRL to MDI SSD1) | 141 ns | 153 ns |
| 1000BASE-T receive latency (MDI start to RX_CTRL) | 227 ns | 235 ns |
| 1000BASE-T sum of transmit+receive latency values | 368 ns | 388 ns |
| 100BASE-TX transmit latency (TX_CTRL to /J/) | 634 ns | 679 ns |
| 100BASE-TX receive latency (MDI start to RX_CTRL) | 362 ns | 362 ns |
| 100BASE-TX sum of transmit+receive latency values | 996 ns | 1041 ns |
(Source: Marvell Alaska 88E1512 datasheet, section 4.15. Total latency is not in the datasheet, but was computed by the author of this paper.)
This would make for a worst case of 388 ns with 1000BASE-T, and 1041 ns with 100BASE-TX.
In addition, the TX FIFO's depth can be configured, which may be used to reduce latency. This comes at the cost of possibly losing synchronization with very large packets (jumbo frames).
Other hardware
As the experimental results show, the Ethernet Debugger has fairly low latency, considering the fact that 2 PHYs are involved in the Ethernet signal path.
Measurements
To determine the actual jitter and latency the devices adds to the Ethernet data stream, an experiment was performed.
Experimental Setup
Due to the lack of alternatives, the Ethernet Debugger itself is used to measure the latency. Three Ethernet Debuggers are involved in this:
- Device A is used to send packets to both of its ports in a synchronized manner.
- Device B is the device under test. Port B is connected to device A's port B, port A is connected to device C's port B.
- Device C is used to receive packets and records the packet timestamps. Device A's port A is connected to device C's port A.

Device A will send two packets to both device B and C at the same time. One of the packets is sent directly to device C, while the other passes through device B before it arrives at device C. The core of the experiment is to measure the time difference between the arrival of both packets. The packet on path A→B→C is expected to arrive later than the packet on path A→C, so the difference must be the latency added by device B. Unfortunately, this also adds jitter from the four other involved ports of devices A and C.
To determine the effect of the device A & C ports, the experiment is repeated with a cable in place of device B.
Avoiding packet cycles
The setup above obviously forms a loop. Normally, that would mean any injected packets would be propagated forever to the next device along the Ethernet cables, which would interfere with interpreting the test packets. To avoid this, device C blocks propagation of packets between the two internal ports by using the host software "disrupt" command. (Device A's ports were blocked in the same manner to avoid error sources.)
Packet injector
The packet injector is a debugging feature, which enables the host to inject single packets into the Ethernet signal.
As long as a single "inject" command is used (i.e. one command that outputs to both ports simultaneously), the hardware guarantees that sending the packet is started at the same clock cycle on both internal ports. (This may require updating to firmware version 1.06 or newer.) Since each port uses an independent clock, this is subject to clock domain crossing, and physically, the packets will start sending at slightly different times. (A fundamental problem: the clock edges may be out of phase.)
A packet is sent roughly every 1 ms (subject to very high host jitter). The packets use a custom pseudo-protocol (essentially nonsense to an observer) using an unassigned EtherType and fixed MAC addresses. Otherwise these should be valid Ethernet packets.
Packet timestamp resolution and jitter
Device C needs to record the timestamps of the received packets in the highest precision and lowest jitter possible in order for the data to be meaningful.
See the Background section for an overview how timestamps are determined. A first version of this paper used modified 1.00 firmware, the modifications were necessary because timestamp jitter was too high. The current version uses firmware 1.06 with improved implementation, and performs roughly as well as the "gray" method in the first published version of this paper.
Ethernet master/slave
Device A was set to be master of both of its Ethernet ports. The host tool command "mdio_write 3 9 0x1b00" was used to achieve this. This most likely does not matter for this test, but was done because it sounded like a good idea.
Performing the experiment
Devices A and C were controlled by the host tool using the latency tester feature (latency_tester_sender, latency_tester_receiver). This feature makes device A send a duplicate test packet on both ports. The hardware ensures that the packet is sent on both ports at the same time (subject to uncertainties, see Background section). Device C computes and records the difference of the timestamps of the two packets when received through both ports and writes them to a file. In all tests, 10000 packets were sent through each path, i.e. each test resulted in 10000 samples. Each sample is the difference of the timestamps of the two packets received through both paths.
Unless otherwise noted, device A was connected with device C with a cable of length 100 cm, and device B used 50 cm cables in both direction, and the same cable brands, types, and quality grades were used. All three devices used identical hardware (same PCB and BOM), and firmware 1.06.
The whole process is somewhat error prone due to the need to manually replug cables and so on. No fully automated test was considered feasible without significantly more effort.
Processing of raw data
The timestamp differences of each packet were plotted as a frequency histogram. X/Y ranges of the plot were usually adjusted manually. Each bar represents a 10 ns value. (As described above, the device's internal timestamp resolution is 10 ns. Note that the Wireshark capture may output timestamps not divisible by 10 ns due to adding the start time wall clock, but differences between packet timestamps will always be multiples of 10 ns.)
Results and discussion
The following presents the results using pretty graphs. The raw data is available on request.
1000 MBit, latency with device
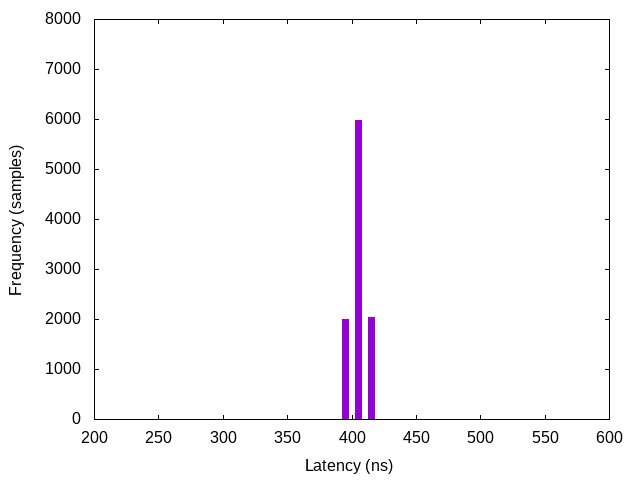
The "normal" latency of the Ethernet Debugger, including extra latency due to measurements. The extra latency means the jitter is a result of the test setup, and may be up to twice of what might be expected from the "actual" numbers of a single device (i.e. device B alone).
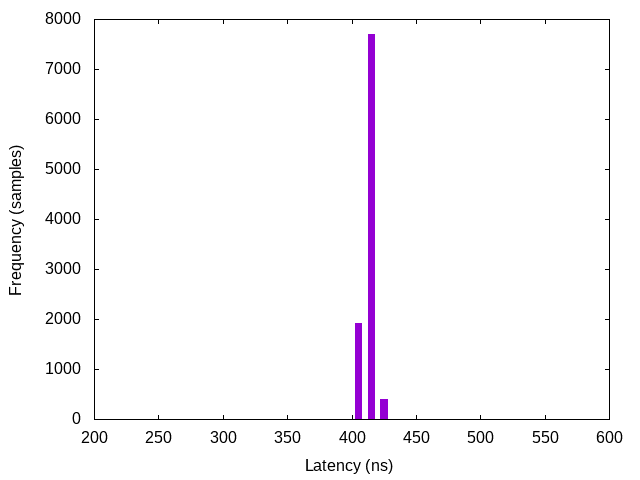
Only three raw sample values actually occurred: 400, 410, and 420. The worst case latency is 420 ns, which is slightly more than the latencies the PHY's datasheet specifies. (368 ns to 388 ns latency, see background section.) The additional latency can partially be explained by the FPGA's DDR block's latency (possibly at least 24 ns in total).
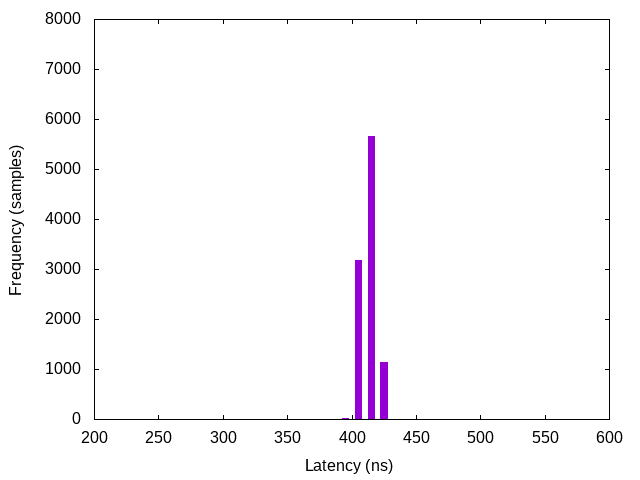
Somewhat different distributions can happen when links are renegotiated. With the same link, results are fairly consistent, but forcing link renegotation (e.g. unplugging cable and plugging it in again) can lead to different distributions. For example, this is under the same circumstances as above, but with a different link:
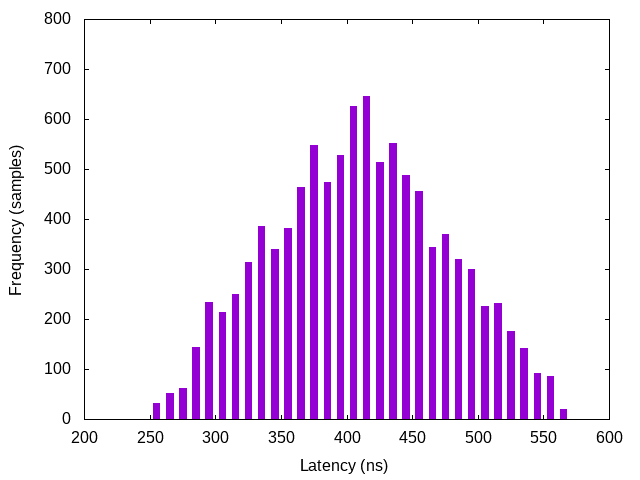
For reference, here is the same measurement with firmware 1.00 (actually not exactly, but for this purpose equivalent to 1.00), which shows a rather different graph due to higher timestamp jitter because the timestamping mechanism wasn't as good (different scale):
1000 MBit, latency with cable
The same experiment as above, but using a cable instead of device B. In this setup, both ports of device A/C were connected with a cable of same brand and length. This possibly visualizes the actual jitter introduced by the measurement setup. There is a strange bias towards port B having higher latency. Repeated tests and renegotiating the link leads to other results (including bias towards port A or results centered around 0 ns, seemingly less common).

This includes 8759 samples of 10 ns latency, and 1241 samples of 0 ns latency. (The graph rendering is somewhat unfortunate, because 0 ns is put in the 0-10 ns bar.)
1000 MBit, latency with long cable
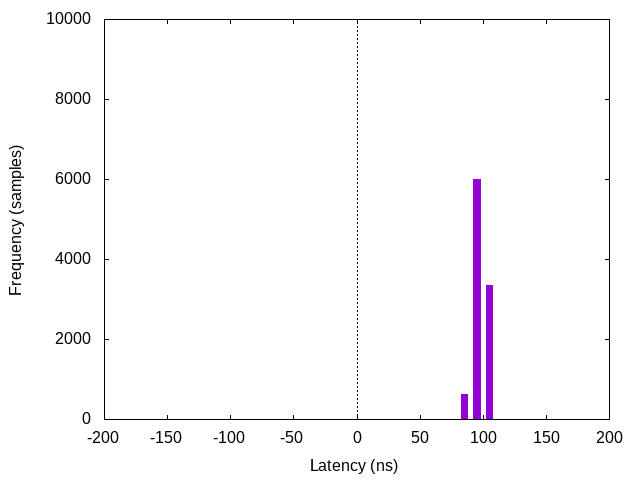
The above experiment was repeated, with a cable of 20 meters. It seems the length of the cable is clearly measurable, and at least causes a change of the latency samples into the expected direction by adding roughly 80-100 ns of delay.
100 MBit, latency with device
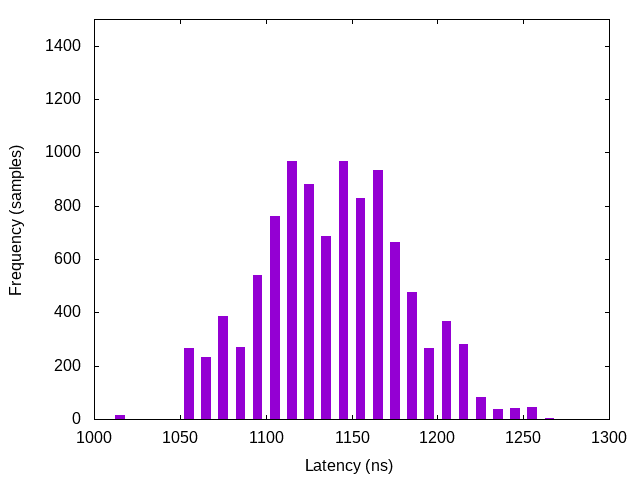
100 MBit mode was enforced with the "speed 100" host command. Otherwise, the setup was the same as with the 1000 MBit measurements. The variance is obviously much higher than with 1000 MBit, which possibly can be explained by the fact that the timestamp resolution relative to the Ethernet signal is much higher.
100 MBit, latency with cable
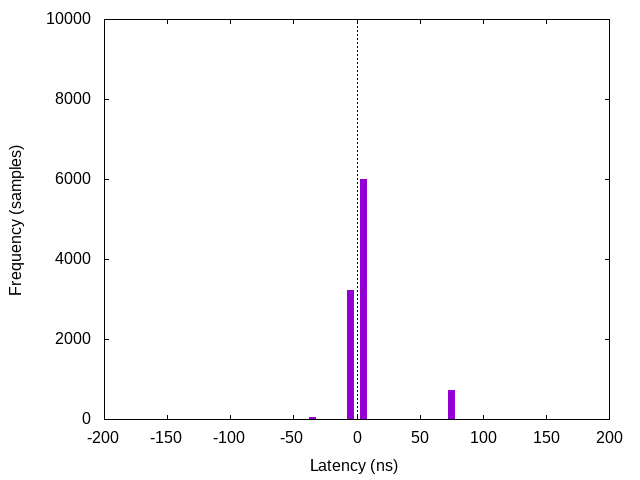
Setup as in the 1000 MBit test with cable. As expected, the latency centers around 0 ns, with some outliers at -40 ns (46 samples) and 70 ns (727 samples). This graph looks much cleaner than the previous one. Maybe this is because the interference from the third device in the previous test spreads the outliers across the range further, or introduces additional jitter
100 MBit, latency with long cable
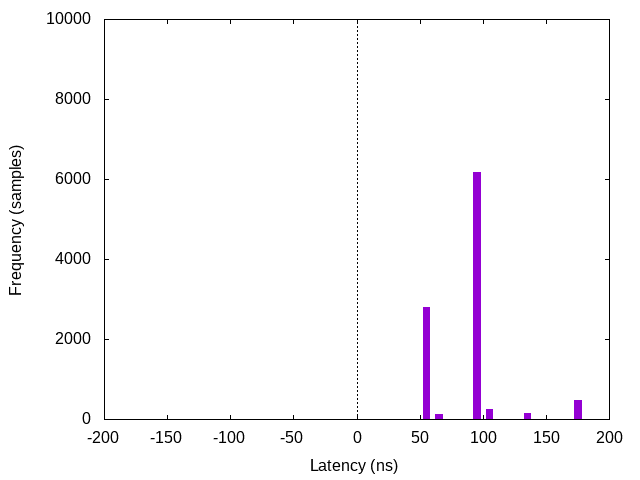
This is with the same cable as in the 1000 MBit test. The results are somewhat similar to the 1000 MBit test, with more jitter.
1000 MBit, latency with different TX FIFO depths
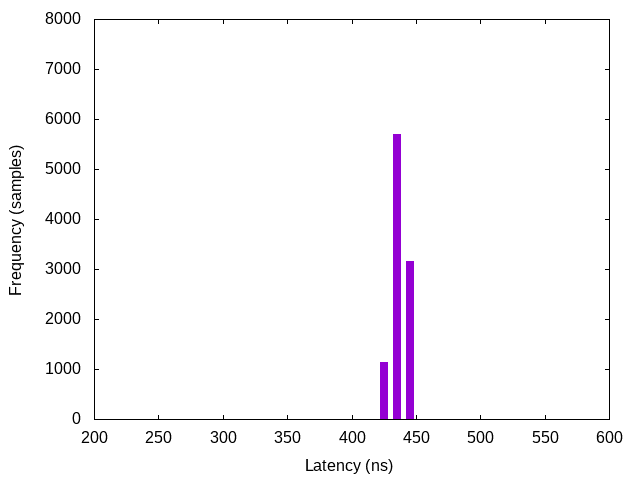
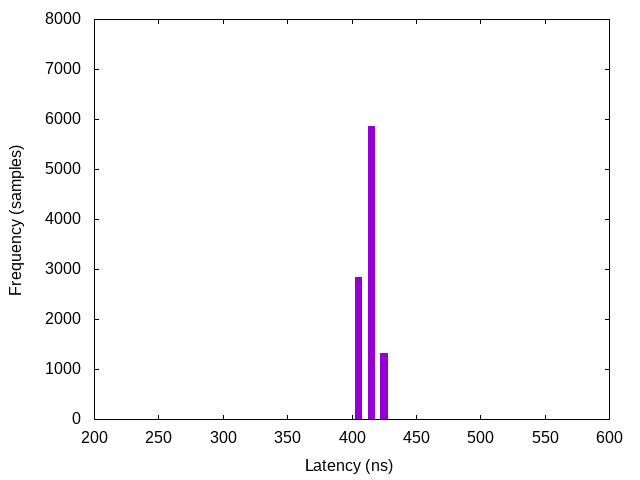
To determine the influence of the TX FIFO depth, and to test whether changing the PHY's default setting helps with reducing latency, tests were performed with 3 FIFO lengths (only 32 bits FIFO depth was not tested). The FIFO settings were changed on device B only. It seems there is possibly enough deviation to confirm that it affects latency, but the effect is not dramatic enough to matter in practice to justify changing the default.
|
|
|
| Lowest FIFO depth | Default FIFO depth | Highest FIFO depth |
(The default FIFO depth graph is just a repeat of the normal 1000 MBit test.)
The exact depths, according to the datasheet (and along with host commands to change the appropriate MDIO registers):
| Depth per datasheet | Host command |
|---|---|
| 16 Bits | mdio_write 3 16 0x448 2 |
| 24 Bits (default) | |
| 32 Bits | |
| 40 Bits | mdio_write 3 16 0xc448 2 |
This list is exhaustive. The 32 bit setting was not tested.
1000 MBit with a consumer switch
This following measurement was done with a TP-Link switch (TL-SG105) in place of the Intona Ethernet Debugger. The purpose of this test is to demonstrate what effect consumer Ethernet hardware can have on latency and jitter.
Device B is replaced by the switch here, which is connected to device A port B with switch port 1, and device C port B with switch port 2. All other switch ports were unconnected. Since there is almost no traffic and the ports do not compete for bandwidth, this test has limited usefulness.
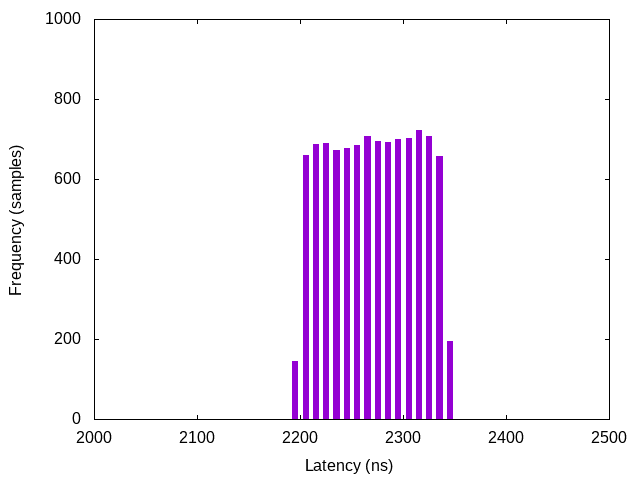
The latency is roughly 5 times higher, with relatively high jitter. A switch probably needs to spend time on parsing the Ethernet headers, looking up the ARP table, and routing the packet to the correct port. For this test, we rely on the fact that it will route packets with unknown MAC addresses to all other ports (the port connected to device C in particular.)
1000 MBit with an AVB switch
The following measurement is as above, but with the PreSonus SW5E AVB SWITCH (using Marvell 88E6352).
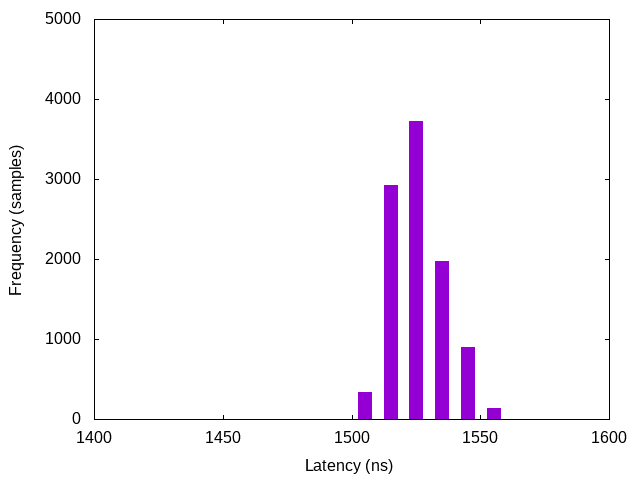
Latency and jitter is much lower (consider the different scale of the graph). Apparently special switches can be worth their money if very low latency is required.
1000 MBit with Intona POEsy switch
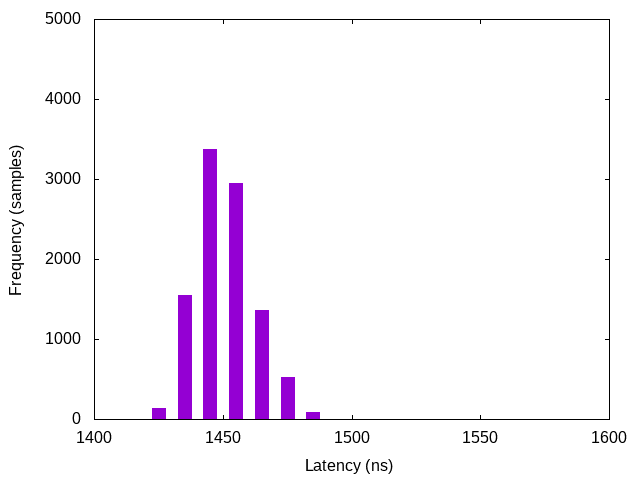
The same as above, but with Intona's POEsy switch (using Marvell 88E6352 as well). It performs slightly better, probably due to configuration differences.
Conclusion
This document explained the causes of additional jitter and latencies. An experiment was performed to approximately measure and quantify the effect of the Ethernet Debugger on Ethernet latency and jitter. The authors think that the results how that the Ethernet Debugger provides nearly ideal latency for the chosen hardware implementation strategy.
Document version: 18 / Sep 01, 2021 13:48
Download this document as PDF
